Multi-layer Ceramic Capacitor (MLCCs) are small size bypass filters that are widely used in electronics design. There are many things to consider before selecting a MLCC, such as dielectric properties, temperature, ripple, size, frequency range, and so on.
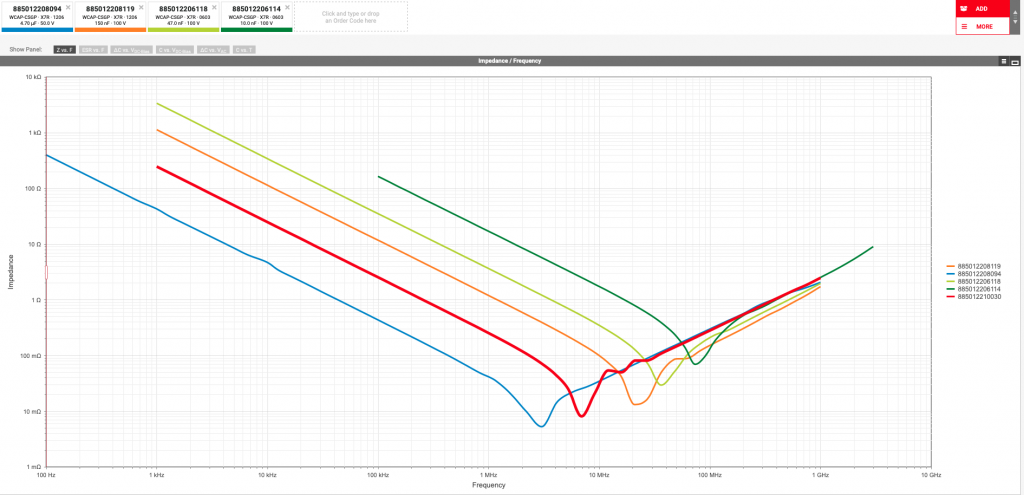
For EMC application, MLCC arrays (a bank of ceramic capacitors in different value and size) often gives a wide range of low impedance path for a certain frequency range, such as what is shown in Figure 1. But how confident are we with the ceramic caps selection? What is the actual performance of a ceramic capacitor?
A measurement of impedance vs frequency curve of a capacitor often tells the true story. But MLCCs are tiny devices, if not measuring correctly, any parasitic inductance or capacitance introduced by the test set-up will ruin the result easily. Note, the high frequency behaviour of a MLCC is largely determined by their equivalent series inductance (ESL), this inductance, however, strongly depends on how the capacitor is connected the rest of the circuit. The ESL numbers published in the data sheets are generally much lower than the parasitic inductance introduced by connection. So the connection inductance is the single most important parameter affecting the high-frequency impedance of a MLCC.
The following example demonstrates a simple and easy set up for measuring the impedance of a MLCC. For this test, you will need a spectrum analyzer with tracking generator (TG) function, an RF housing unit such as this one from Tekbox https://www.tekbox.com/product/tbrfh2-rf-housing/ Small metal plate and some copper tape.
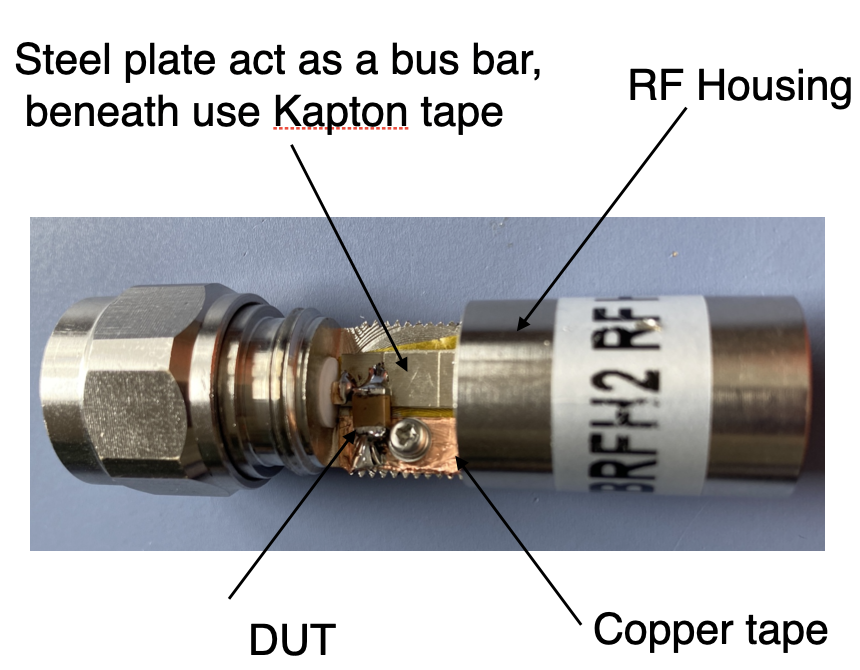
The construction is rather simple and straight forward, the key point taken is to try to minimise the loop inductance as much as you can. In this example, I made a small (but wide enough) metal plate connecting the input port and output port of the RF housing unit, on the back side I put 2 layers of Kapton tape to achieve a good insulation between the shielding of the unit and the input/output port. Then a similar width of copper tape is taped firmly on the shield surface, with screws in, this achieves a rather good electric connection. The device under test (DUT) in this case is a Würth 1812 1μF capacitor (Part No. 885 012 210 031). Simply solder the DUT between the two conductive planes inside the RF housing. A complete circuit is shown in Figure 2.
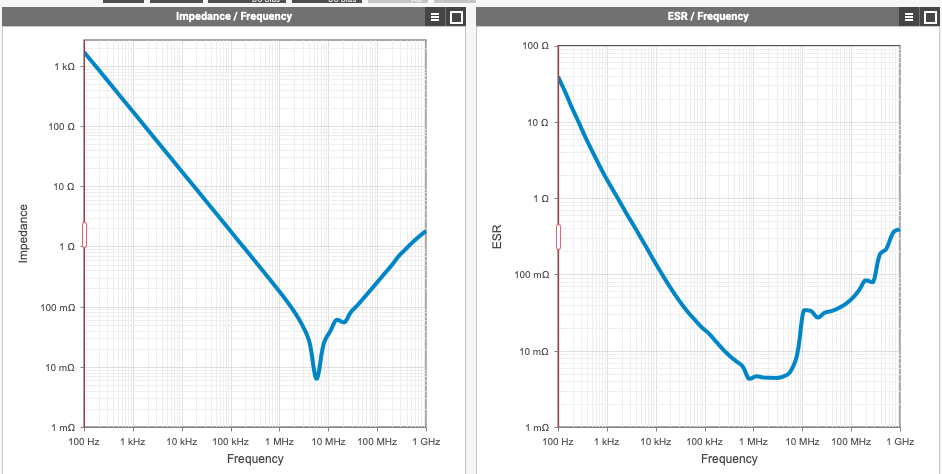
It is worth mentioning that before the test, I used Würth component selection tool Redexpert https://redexpert.we-online.com/redexpert/ to find the electric characteristics of this capacitor, and the important ones are shown in Figure 3.
Connect the RF housing unit between the tracking generator and the RF input, enable TG function and do a sweep between 10kHz and 1 GHz, I also set the attenuator as 0, pre-amplifier off. The resolution bandwidth I chose is 100kHz. The amplitude of the TG output is set as -10dBm. For the unit to display on the spectrum analyzer, I chose V rather than dBm, for the reasons that I can then compare the measurement result with my simulation result. See later. Figure 4 shows the measurement result of the DUT.
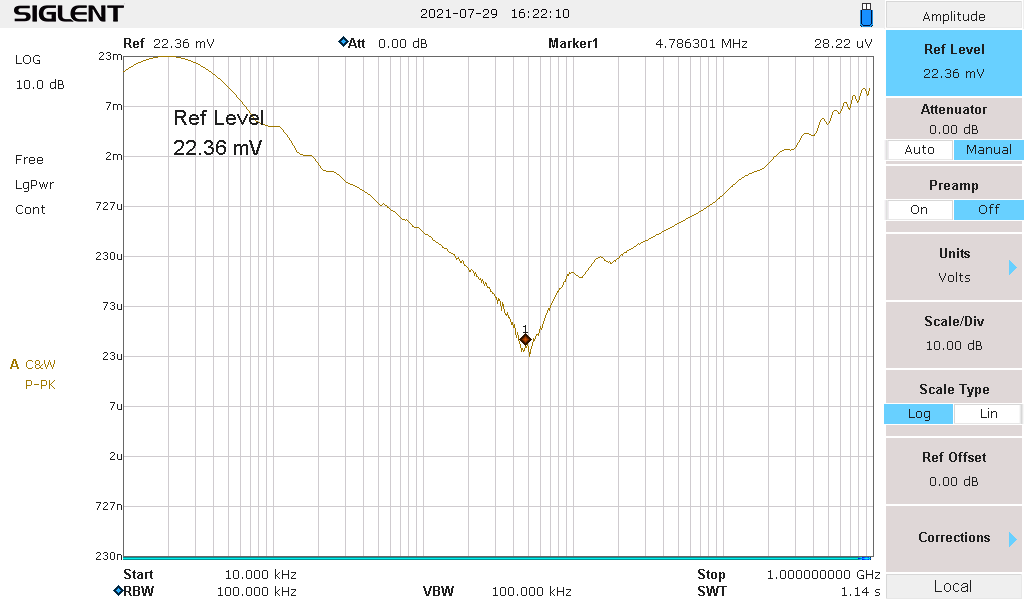
The measurement result shows a self resonant point of 4.6 MHz, this gives us the confidence that this capacitor would work well in a frequency range between 2 MHz and 10 MHz. But how do we know our measurement is accurate enough?
We can cross check with our simulation model. In Simetrix, a very simple model was built to simulate the test set-up. This simulation model takes the parasitic capacitance and inductance of the connection into account, the cable is modelled as a lossy transmission line. AC analysis gives a pretty close result to the actual measurement. Note that in Simetrix, in order to have the same output as the test set-up measurement, we need to adjust the voltage source amplitude to match the TG output. The TG output was -10dBm, which is about 200mV peak to peak voltage on a 50Ω system. In Simetrix model, the AC magnitude is set as 210mV to match this. The output of this test is actually gain plot rather than impedance vs frequency curve.
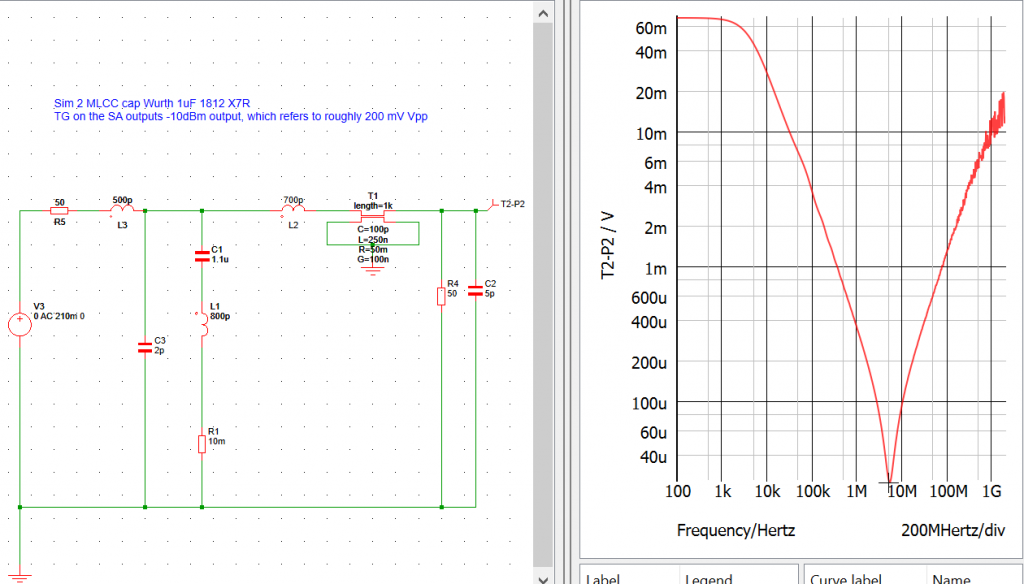
By using this simple set-up, we can visually see how good a ceramic capacitor is, in which frequency range it is most effective. With this set-up, we can easily build an array of capacitors and tests the overall bypassing performance of the capacitor array, hence gaining confidence in our EMC troubleshooting/system design.
A video of this test set-up can be found below: